Picture two investors who both held all their wealth in Tehran-listed equities from Mordad 1399 (August 2020) to today. The first looks at the "total index" (TEDPIX) chart and sees fresh nominal records. The second measures the very same portfolio in dollars and sees that its value is still roughly 56 to 60 percent below the Mordad 99 peak. One market, one window, two completely contradictory truths, and the only difference is the unit of measure. This entire article is about that point: before you choose an asset, you must choose your unit of measure and your risk factor.
In investment-management theory, "asset allocation" is the decision about which asset class each rial of capital sits in, and at what weight. This decision, not the selection of individual stocks, forms the first layer of portfolio risk.
The number almost every source gets wrong. The classic study by Brinson and colleagues (1986) and its more careful re-reading by Ibbotson and Kaplan (2000) separate three distinct figures, and conflating them is the source of most confusion:
- Allocation policy explains roughly 90 percent of the variability of a portfolio's return over time.
- But its share in explaining the difference in returns between different funds is only about 40 percent.
- And on average, asset allocation explains roughly 100 percent of the level of return (that is, on average, timing and selection together add nothing net).
The conclusion: asset allocation is not everything, but it is the ground on which stock selection acquires meaning.
The problem is that these frameworks were written for an economy with two features: low, stable inflation, and a genuine risk-free asset. Iran's market has neither. So copying the conventional models without rewriting their assumptions is a structural error. The basic risk-return relationship and the types of risk that threaten a household's capital are laid out in Sahmino's learning hub and are a conceptual prerequisite for this article.
1. Four structural differences that neutralize the standard model
a) There is no "risk-free" asset
In conventional models, a bank deposit or government bond plays the role of the risk-free anchor. In Iran, when the nominal interest rate sits below the inflation rate, the real return on these instruments is negative. That is, the safest nominal option delivers the most guaranteed real loss. A deposit or a fixed-income fund in an Iranian portfolio is not a "store of value" instrument; it is a tool for liquidity management and optionality, and it should be weighted for exactly that function. The key sentence: a deposit is not a store-of-value instrument, it is an optionality instrument.
b) A shared currency anchor and false diversification
The most common mistake in Iranian portfolios is nominal diversification: equities, gold, coins, FX and property held side by side, on the assumption that five independent asset classes have been bought. But a large share of these assets share one risk factor: the exchange rate. Commodity-linked equities (metals, petrochemicals, refiners), gold, coins and housing all carry some degree of dollar beta. As a result, a portfolio that is diversified on paper is, in practice, a concentrated bet on a single variable.
The practical consequence: diversification must be measured by risk factors, not by asset names. The three main factors in Iran's market are the exchange rate, global commodity prices, and domestic policy/systematic risk. The tool for measuring this diversification is correlation; and as the "Framework Under Test" section shows, correlations rise in a crisis, meaning diversification evaporates exactly when you need it most.
c) No hedging instruments, and uneven liquidity
Iran's market is effectively without a broad hedging instrument; the daily price-fluctuation limit and the buy/sell queues create a "liquidity halt" at precisely the moment you need it. Housing can take months to sell. This means liquidity is itself an independent dimension of allocation, not a secondary attribute.
d) Administered pricing and policy risk
The feedstock price, the electricity tariff, car pricing, energy quotas and currency intervention can shift an industry's profitability without any change in the global market. This risk cannot be diversified away; it can only be budgeted for.
2. First, choose your unit of measure
Before any weighting, you must decide the unit in which you measure the portfolio. Three common choices:
- Nominal rial: simple but misleading. A 40 percent gain during 50 percent inflation is a loss (money illusion).
- Real rial (inflation-adjusted): the correct yardstick for measuring purchasing power.
- Dollar or a currency basket: the correct yardstick for someone whose obligations or goals are denominated in foreign currency.
A portfolio's objective should be defined in the same unit in which the investor's obligations are measured. Changing the unit of measure completely reshuffles the ranking of asset classes. The best living example of this claim is the Tehran market itself.
Case study: the dollar value of the bourse versus the nominal index
Since Mordad 1399 (August 2020), TEDPIX has repeatedly reached fresh nominal highs. But if we measure the same market in dollars, the picture inverts: the market's dollar value has remained roughly 56 to 60 percent below the Mordad 99 peak. An investor whose dollar purchasing power matters has, over the very window in which a "historic record" was set, effectively lost a large part of their wealth.
This claim is reproducible, and the method is simple: divide the total market value by the free-market dollar rate (or, for a quick estimate, divide the index itself by the dollar rate). We deliberately do not cite a single figure for the market's "dollar peak," because Persian sources report it anywhere between 340 and 396 billion dollars and they do not agree; what is reliable is the direction and the order of magnitude of the ratio, not the absolute number. To track the index and the dollar in real time, see the TEDPIX and dollar pages in Sahmino's price section.
A currency hedge is not an inflation hedge. A common belief is that any asset with a high "dollar beta" is also an inflation shield. Studies of exchange-rate pass-through (ERPT) in Iran refute this: the pass-through of the exchange rate to consumer prices is incomplete and gradual. One estimate puts pass-through at about 30 to 40 percent; another, using a vector autoregression (VAR) model for the 1382 to 1397 (2003 to 2018) period, shows this coefficient for the consumer index rising from around 14.7 percent in the first sub-period to around 51.8 percent in later ones. The practical portfolio consequence: a high-dollar-beta asset does not necessarily deliver a positive real return; an FX jump can lift your nominal figure while simultaneously eroding your purchasing power.
3. The true role of each asset class
The table below describes each class by its function in the portfolio, not by a prescriptive weight. There is no "buy 30 percent gold" here; the buckets are explained by obligations, not by prescription.
| Asset class | Role in the portfolio | Primary risk |
|---|
| Commodity-linked equities | Inflation/FX hedge with operating cash flow | Policy risk on feedstock and energy, global price |
| Bank and service equities | Leverage on liquidity and nominal growth | Balance sheet, regulation, asset quality |
| Fixed-income fund | Liquidity and optionality | Negative real return under high inflation |
| Bank deposit | Short-term cash reserve, not a store of value | Negative real return, repricing risk |
| Government bonds (Akhza, Murabaha) | Dated instrument with a defined nominal yield | Interest-rate risk, sovereign credit risk, negative real return |
| Gold fund | Access to gold with exchange-traded liquidity | Fund premium on top of coin premium, issuer risk |
| Coins and physical gold | Store of value, crisis asset | Premium, storage, buy/sell spread |
| Foreign currency | Base risk factor, not necessarily a productive asset | Intervention, multi-rate market, no cash flow |
| Housing | Long-term store of value plus rent | Very low liquidity, transaction cost |
| Real-estate fund | Exchange-traded access to property in small units | Trades at a positive or negative premium to asset value, shallow market |
| Car | A real household-portfolio asset; a commodity store of value | Physical depreciation, administered-pricing premium, variable liquidity |
| Crypto and Tether | Currency access and high risk appetite | Issuer/platform risk, volatility, legal risk |
Three notes on this table. First, the car is a real asset class in the Iranian household basket (and we track its price too); leaving it out of the analysis is an obvious gap. Second, the real-estate fund teaches an important lesson, that "the premium is an independent decision variable," because these funds can trade above or below their net asset value, just like the property-holding shares examined in Separdis Under the Lens. Third, the breakdown of fund types (fixed-income, equity, balanced, gold and ETF) is covered in What Is an Investment Fund.
Capital-gains tax is a first-order decision variable, not a footnote. As this tax base is phased in, the after-tax return of different asset classes can reshuffle their ranking; it must be factored in at the weight-setting stage, not at rebalancing.
Methodology: why this article does not quote long-term return figures from secondary sources. Long-term return figures in Persian sources are irreconcilable. For example, TEDPIX's ten-year return is reported as roughly 55.5x in one source and about 33x in another; gold's as roughly 19.7x in one and more than 170x in another. These contradictions usually stem from differences in the start and end dates, the treatment of cash dividends and capital increases, and the inflation-adjustment method. Our editorial rule is: we quote no return figure from a secondary source; we publish only our own calculation, with an explicit time window and a methodology box. The full dataset of nominal, real and dollar returns, together with maximum drawdown and recovery time for each asset class, will be added in a data update to this article; until then, rather than quoting an unreliable number, we say plainly that this series has not yet been published.
4. Market snapshot box
Daily figures go stale quickly, so we have separated them from the body of the article. The table below is a dated "snapshot," not part of the long-term framework:
| Asset | Price | Unit |
|---|
| Free-market dollar | 188,190 | toman |
| Tether (toman) | 187,436 | toman |
| 18-carat gold (per gram) | 18,252,900 | toman |
| Emami coin | 184,980,000 | toman |
| Emami coin premium | 7,746,000 | toman |
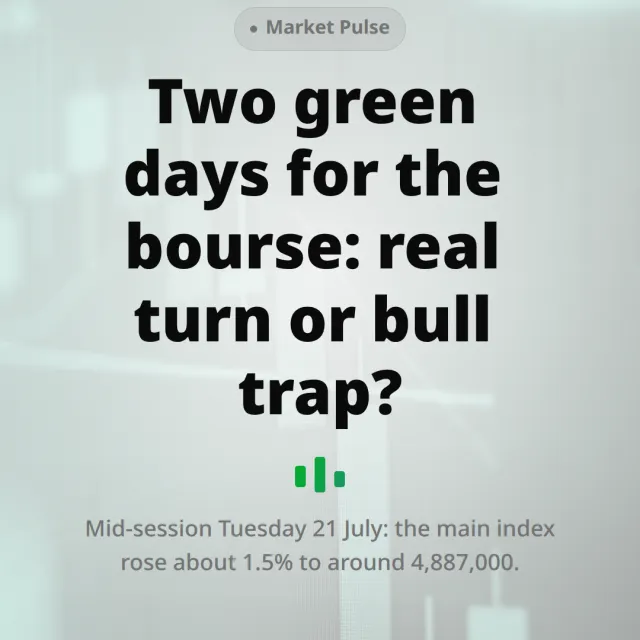
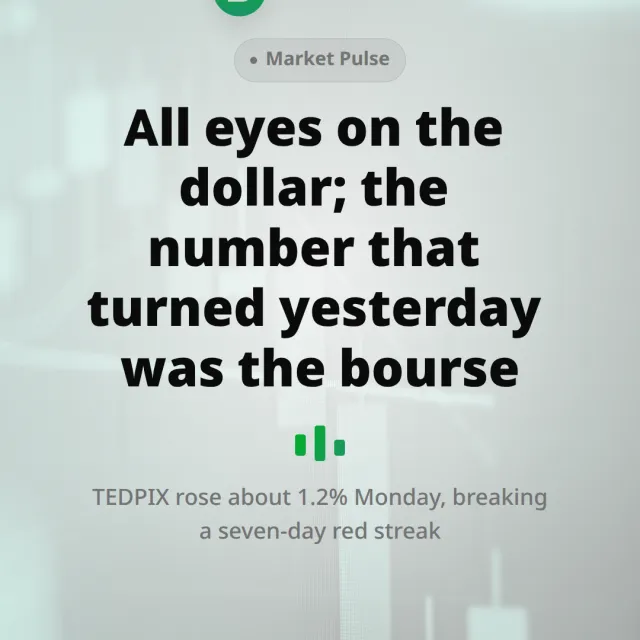
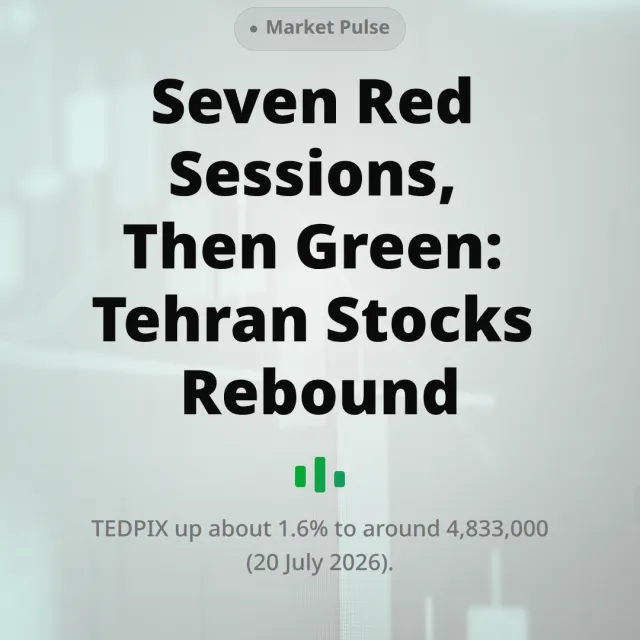
| TEDPIX (Tehran total index) | 4,893,834 | index |
Snapshot as of Thursday, 25 Tir 1405 (16 July 2026); the TEDPIX figure is from the close of the last trading session (24 Tir), because the bourse is closed on Thursday and Friday. For the latest figures, always see Sahmino's price pages. The evergreen lesson of this table is simple: when the coin premium is high, buying a coin means buying the premium, not buying gold; part of a coin's daily return can come not from gold and not from the dollar, but from emotional demand.
5. The framework under test: the Tir 1405 shock
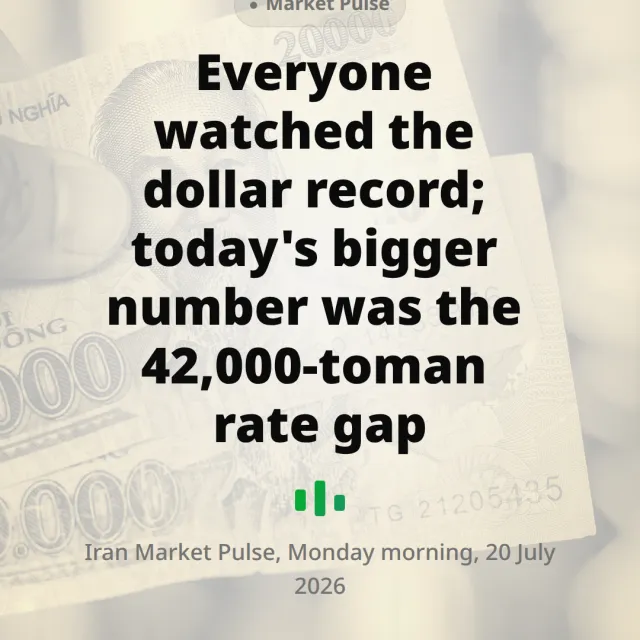
The best stress test of any framework is a real crisis. The Tir 1405 (July 2026) shock, a naval blockade of the ports, the free-market dollar's jump to a record of about 188,000 toman, and the divergence of global and domestic gold, is exactly the moment to test this article's claims. In that shock, what we described in theory was seen in practice: the correlation of dollar-driven assets (dollar, gold, coin) rose and they jumped together, while the stock market moved the other way or stayed flat; that is, the "false diversification" of a multi-asset portfolio collapsed, in the crisis, into a concentrated bet on the exchange rate. At the same time, the divergence of domestic and global gold showed that even a "crisis asset" can build a local premium. The daily narrative of that dynamic is in Iran's Dollar Crosses 180,000 Tomans.
6. From strategic allocation to rebalancing
SAA versus TAA
Strategic asset allocation (SAA) is the set of long-term weights that flow from the investor's time horizon, obligations and loss-bearing capacity, and it should not change with a news headline. Tactical asset allocation (TAA) is a controlled and limited deviation from those weights, within a pre-defined band (for example, at most plus or minus 10 percentage points) and preferably with an expiry date. TAA without a written ceiling turns, in practice, into emotional trading.
A bucket structure instead of bare weighting
- Liquidity bucket: covers needs for the next 6 to 18 months. Its measure of success is access, not return.
- Purchasing-power preservation bucket: gold, commodity-linked equities, assets with currency beta. Goal: a real return near zero or positive.
- Growth bucket: growth stocks, IPOs, higher-risk assets. Its ceiling should be sized so that its going to zero would not change your life plan.
The rebalancing rule
Two common approaches: calendar rebalancing (for example, every six months) and band-based rebalancing (when a class's weight drifts more than 20 percent relative to its target). In an inflationary economy there is a subtlety: frequent rebalancing pulls you out of the asset winning the inflationary trend too early, and during a currency surge it creates a heavy opportunity cost. Conversely, not rebalancing means allowing one asset class to seize the portfolio's entire risk. The middle path is usually wider bands, plus treating transaction costs and taxes as part of the decision, not a footnote. (A quantitative test of these three scenarios, no rebalancing versus calendar versus band-based, on real Iranian data, will be added in a data update to this article.)
7. The metrics to monitor
- Real return, not nominal, and the correlation of asset classes in that same unit of measure.
- Maximum drawdown and the time to recover, not merely standard deviation. This metric matters more to a household than standard deviation, because it speaks the language of "how deep and how long was I underwater."
- Scenario-based liquidity: if tomorrow you needed 30 percent of the portfolio, how much would be locked in a queue? Each asset's break-point differs: a sell queue and symbol suspension for equities, the fluctuation limit for the bourse, and frozen trading for housing.
- Issuer and custody risk: funds, crypto platforms, physical gold; each has a single point of failure.
- Premium: for coins and gold funds, the distance from intrinsic value is an independent decision variable.
8. The behavioral layer: errors that do not show up in the numbers
Even a correct framework can be neutralized by investor behavior. Three recurring biases that directly damage asset allocation:
- The disposition effect: the tendency to hold on to a losing asset and sell a winner too early. This is the exact opposite of rebalancing logic and rots the growth bucket from within.
- Recency bias: weighting assets by last year's return, meaning you enter at the peak and exit at the trough.
- Anchoring: clinging to the "purchase price" as the reference for a decision, instead of today's value and the forward outlook.
The antidote to all three is a written investment policy statement that separates the decision from the emotion of the moment.
9. Recurring mistakes in Iranian portfolios
- False diversification: five assets with one risk factor.
- A nominal anchor: celebrating a 40 percent return under higher inflation.
- Weighting by past return; entering at the peak of a premium.
- Ignoring liquidity until the moment it is needed.
- The absence of a written Investment Policy Statement (IPS); without one, every decision is justifiable after the fact.
An execution checklist
- Write down your unit of measure and your time horizon.
- Separate and secure your cash obligations for the next 18 months.
- Decompose the portfolio by risk factors (currency, commodity, domestic policy), not by asset name.
- Set the strategic weights and the permitted range of tactical deviation.
- Write the rebalancing rule, the loss ceiling and the exit conditions in advance.
- Review real return and correlations every three months, rather than watching prices every day.
Sources
- Brinson, Hood & Beebower (1986), "Determinants of Portfolio Performance."
- Ibbotson & Kaplan (2000), "Does Asset Allocation Policy Explain 40, 90, or 100 Percent of Performance?"
- Exchange-rate pass-through (ERPT) literature for Iran's economy; vector-autoregression-based estimates for the 1382 to 1397 (2003 to 2018) period.
- Baur & Lucey (2010) and Baur & McDermott (2010), on gold's role as a "safe haven" and a "hedge."
This material is educational and descriptive and is not investment advice; it prescribes no weights ("buy X percent gold"). The price figures in the "snapshot box" are dated and change quickly; for the latest data, see Sahmino's price pages.

 Market update
 Market update
 Market update
 Market update