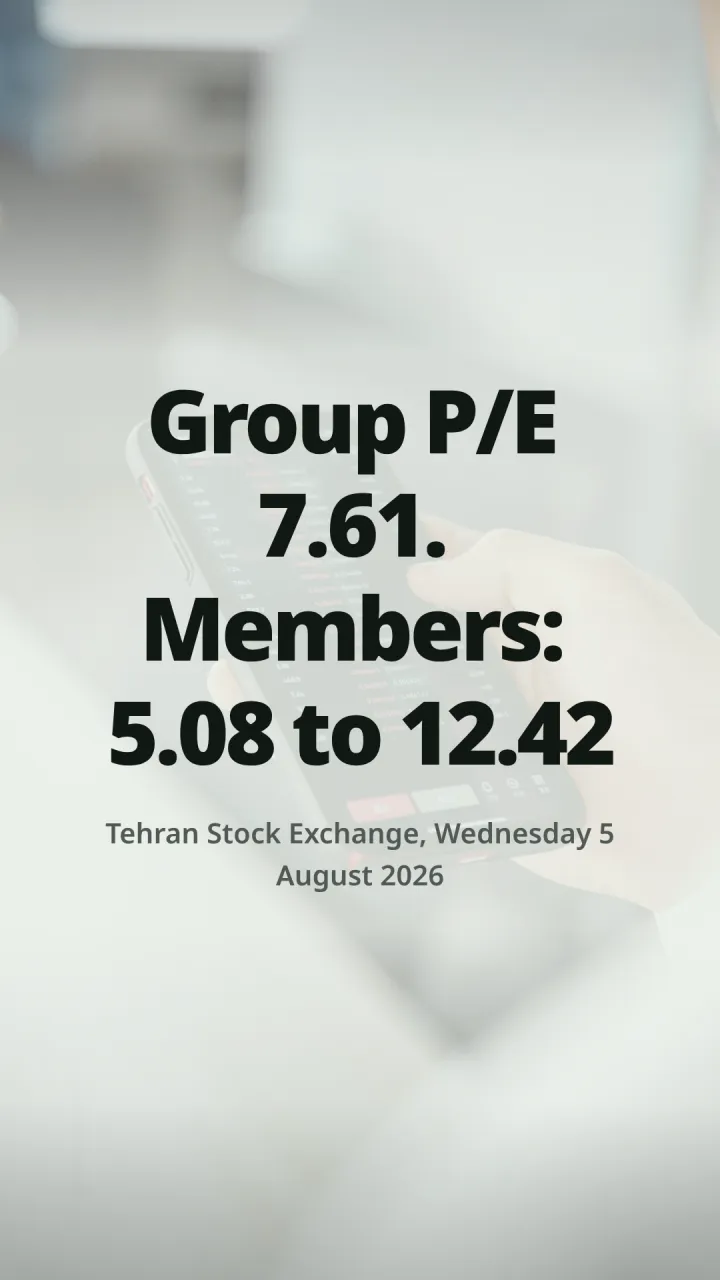
The most common valuation sentence on the Tehran Stock Exchange is a comparison: "this share's price to earnings ratio is lower than its group's, so it is cheap." At 09:42 on Wednesday 5 August 2026 (14 Mordad 1405), the P/E of the "multi-industry industrial companies" group stood at 7.61. Yet at that same moment three of the group's largest members sat on the board at 5.08 (Omid Investment Management Group, ticker وامید), 7.81 (Ghadir Investment, وغدیر) and 12.42 (Social Security Investment Company, شستا), according to the Tehran Securities Exchange market data system.
The gap between the priciest and the cheapest member is 2.45 times. When two companies that far apart sit under one label, the sentence "cheaper than its group" no longer proves very much: depending on which member you compare against, the same share is both cheap and expensive.
This report passes no judgement on the value of any of these tickers and is not a recommendation to buy or sell. The multi-industry group is used here purely as a device for explaining method: we want to see what the number quoted as "the group average" is actually made of, and where it stops meaning anything.
Background: how an "industry" is defined on the Tehran exchange
According to Mehr News Agency on 4 August 2026 (13 Mordad 1405), the market value of 803 active listed companies across 48 industries reached 18,188 hemat (one hemat is 10 trillion rial). The distribution across those industries is wildly uneven: basic metals leads with 54 companies and 3,617 hemat, chemical products is second with 71 companies and 3,580 hemat, and the multi-industry industrial companies group ranks fifth with only 9 companies and 1,132 hemat.
That figure of 9 is decisive. When a group has 9 members, its "average" is effectively the average of a handful of large companies, and each member carries heavy weight in it. By contrast the investment companies group, with 71 companies and 819 hemat of market value, has an average built from a crowd of small firms. Two entirely different structures, both handed to the reader under one shared label, "sector P/E", with no indication of how many companies stand behind each number.
Here is the crux: industry classification on the Tehran exchange follows a company's registered field of activity, not where its profit actually comes from. That single distinction is the root of all three problems below.
The numbers: the multi-industry group, opened up
The figures below are from the Tehran Securities Exchange market data board at 09:42 on Wednesday 5 August 2026. Each ticker's P/E is the closing price divided by earnings per share.
| Ticker | Company | Closing price (rial) | EPS (rial) | P/E |
|---|
| وامید | Omid Investment Management Group | 4,750 | 935 | 5.08 |
| وغدیر | Ghadir Investment | 15,120 | 1,936 | 7.81 |
| شستا | Social Security Investment Company | 2,410 | 194 | 12.42 |
| Reported P/E of the multi-industry industrial companies group | 7.61 |
One note on شستا: no trade had been recorded on the ticker by 09:42 on Wednesday 5 August, so the price of 2,410 rial is the closing price of the previous session, Monday 3 August 2026 (12 Mordad 1405). Tuesday 4 August was a public holiday for Arbaeen. Earnings per share and the group ratio were read from the board at the same moment.
Drivers: the three assumptions nobody says out loud
First assumption: members of a group do similar work
In groups such as multi-industry and investment companies this simply does not hold, because their members are holding companies whose profit comes mainly from dividends paid up by subsidiaries rather than from selling a particular product. But the problem runs deeper: the group label itself is not stable.
At that same moment on the morning of 5 August 2026, three listed holding companies sat under three different labels and were therefore measured against three different group benchmarks: وغدیر in "multi-industry" with a group P/E of 7.61, پارسان (Parsian Oil and Gas Development) in "chemical products" with a group P/E of 7.93, and ومهان (Mehr Ayandegan Financial Development Group) in "investment companies" with a group P/E of 6.24. The distance between the highest and lowest of those three benchmarks is 27 percent.
In other words, a holding company with a fixed ratio of 7.0 can look both "cheaper than its group" and "more expensive than its group" purely according to which group it happens to be registered in. The yardstick changed, not the company.
Second assumption: the group average is built from like figures
The simple average of the three members above is 8.44, while the reported group figure is 7.61. These two numbers are not the same, and are not meant to be: the group ratio is a weighted average in which larger companies sit more heavily, whereas a reader hearing "group average" usually pictures a simple average.
The effect of a single member can be measured directly. Drop شستا from those three and the simple average of the remaining two falls from 8.44 to 6.45, close to a two-unit shift from removing one company. In a group with 9 members in total, that sensitivity is the rule, not the exception.
The second issue is loss-making companies. A P/E is undefined for a company with no profit, so that company drops out of the average altogether. The result is that the group average is built only from profitable members, and the weakest part of the group never appears in the final number. That is the same trap examined from the single-stock angle in A Low P/E Does Not Always Mean Cheap.
Third assumption: fiscal years line up
The earnings per share figure on the board belongs to each company's own reporting period. Fiscal years on the Tehran exchange are not uniform, and period ends are scattered across different months. Averaging those figures therefore places profits from non-simultaneous periods side by side: one company's number may cover the year ending in Esfand, while the next company's closed several months earlier or later.
In an economy where year-on-year inflation was recorded at 87.9 percent in Tir 1405 (July 2026), that mismatch is not harmless; a few months' difference in period end means the profits were written in different purchasing power. We opened up the mechanics of that distortion in Trailing P/E Under 87.9 Percent Inflation.
Outlook: what a better comparison looks like
The alternative is not to throw the ratio away; it is to build the peer set yourself. A company's real peer is one with a similar revenue model and cost structure, not one that merely happens to be filed in the same official classification row.
Three questions before accepting "cheaper than its group": first, how many companies are in this group, and does its average hinge on one or two large members. Second, does this company's profit come from selling a product or from subsidiary dividends, and are the other members the same. Third, does this company's fiscal year match those it is being compared with. If any of those answers is unclear, the group number is a place to start asking, not a conclusion.
For a holding company, measures such as net asset value are usually more informative; the differences between those tools and where each one breaks down are set out in Valuing a Stock With Three Tools. Current ratios can be followed on the prices page.
Bottom line
On the morning of Wednesday 5 August 2026, a 9 member group with a reported ratio of 7.61 held members trading between 5.08 and 12.42, and three holding companies were measured against benchmarks ranging from 6.24 to 7.93 depending on their label. What matters is this: "cheaper than its group" is not a measurement, it is a comparison against a number that is itself constructed and fragile.
If one thing survives from this report: before accepting that a share is cheaper than its group, ask how many companies that group is built from, and whether those companies genuinely do similar work.
What to watch
New quarterly filings on Codal, which move earnings per share and therefore both sides of this ratio; reclassification of tickers between industry groups, which changes a company's group benchmark without anything changing in the company itself; and the membership of thinly populated groups such as multi-industry, where one member joining or leaving visibly moves the average.