
TEDPIX vs the Equal-Weight Index: What Sets Them Apart and Why They Diverge
Learn what the Tehran Stock Exchange's overall index (TEDPIX) and its equal-weight index each measure, why one can turn green while the other stays red, and what a divergence between them signals about market breadth and real-money (retail) inflows. A labelled hypothetical shows how an index can rise while most stocks fall.
Transcript
The overall index turns green, but when you check your own portfolio most stocks are red; how can that happen? In this lesson we learn how the overall index and the equal-weight index differ, and why their divergence matters. Because leaning on a single index alone can mislead you about the real state and the true depth of the market. The overall index is market-cap weighted, so each firm counts on the index in proportion to its own size. That is exactly why only a few large tickers, the ones called index makers, set the direction of the whole index. But in the equal-weight index every company carries the very same weight, and large or small makes no difference at all. In short, the overall index weights the market's money, while the equal-weight index simply counts the number of stocks. Suppose a small market has only three firms; Company A is large, and the other two companies are both small. If Company A rises ten percent while the two small firms each fall five percent, the overall index turns green. But the equal-weight index stays near zero, which means that two of the three stocks were actually red that day. The reverse can happen too: if one large ticker drops, the overall index turns red while most stocks are green. When the equal-weight index leads the overall index, the rise is broad and usually signals real-money inflow. When only the overall index leads, the rise is narrow and leans on just a few large tickers, not the whole market. A real example: on the twelfth of July twenty twenty-six, both indices fell, but the equal-weight index fell less. Both indices are published on the official exchange system; you should compare the percent change, not the raw numbers. So drop the very common mistake of thinking that a green overall index means every single shareholder made money. To sum up, watch both indices side by side every single day so that you can read the market's true pulse. Find the full lesson on Sahmino dot com; and if you have any question, be sure to leave a comment for us below.
Related videos
 01:21Short
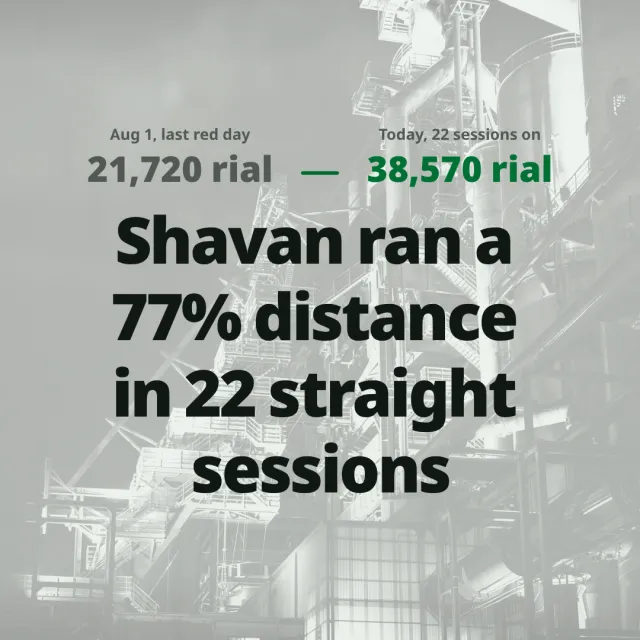
Shavan Shares Rose 77.6% Over 22 Straight Sessions While Quarterly Profit Fell 90% (Saturday, September 5, 2026)
 01:15Short
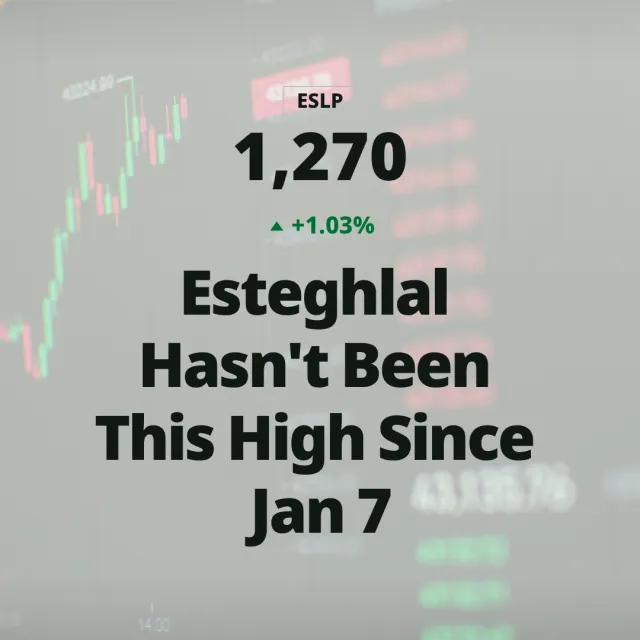
Sports Ministry Fully Exits Esteghlal Football Club's Shareholder Register; Its 3.1% Stake Lands at a Persian Gulf Financial Group as the Stock Hits an Eight-Month High (Wednesday, September 2, 2026)
 01:12Short
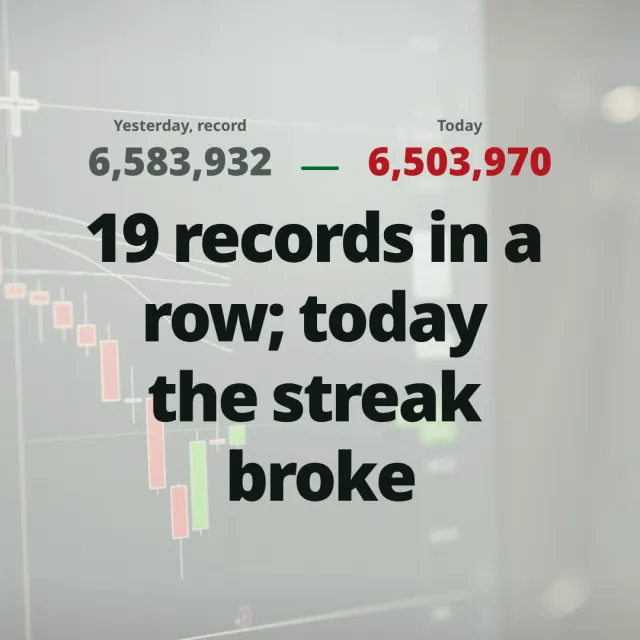
Tehran's TEDPIX Falls 1.21% Today, Wednesday, Ending a Rally of At Least 19 Straight Gaining Sessions (September 2, 2026)
 01:02Short