
Vomahan Under the Lens: Why Mehr Ayandegan Financial Group Should Be Judged by Price to Net Asset Value, Not Profit Margin (Tuesday, 14 July 2026)
A reader asked, "What do you make of Vomahan?" The right answer starts with one fact: Vomahan, the ticker of Mehr Ayandegan Financial Group, is an investment holding on Iran's OTC market (Farabourse), not a factory. For this kind of stock the correct yardstick is not profit margin or a simple P/E, but price to net asset value (P/NAV). The last price is 7,380 rials (Sahmino, 14 July 2026), and the stock has historically traded at a discount to NAV. Not investment advice.
Transcript
One of you asked what we really make of Vomahan, so here is a fully neutral look using official data. But first, one key point: Vomahan is not a factory, it is an investment holding. Its last price on July fourteenth was seven thousand three hundred eighty rials, up about three percent. Its full name is Mehr Ayandegan Financial Group, backed by the Oil Industry Pension Fund. Look at three numbers together: price, the fund's stake, and price to N A V. For a holding, the key metric is not profit margin, but net asset value, or N A V. Price to N A V tells you whether the share trades at a discount to its assets. Vomahan has historically traded between fifty-two and seventy-two percent of N A V, a discount. Its portfolio is full of big names: Ghadir, Golgohar, Isfahan Refining and National Copper. Profit has two sources: dividends, which are steadier, and share sales, which are volatile. A large capital increase is under way, so always check the share count. The free float is thin, since about seventy-nine percent sits with the state shareholder. And since its assets are a basket of big stocks, its value mirrors the whole bourse. So watch where price to N A V sits versus its own and the industry average. This is analysis, not advice. The full analysis is on Sahmino. Is the holding discount an opportunity or a permanent warning? Comment below.
Related videos
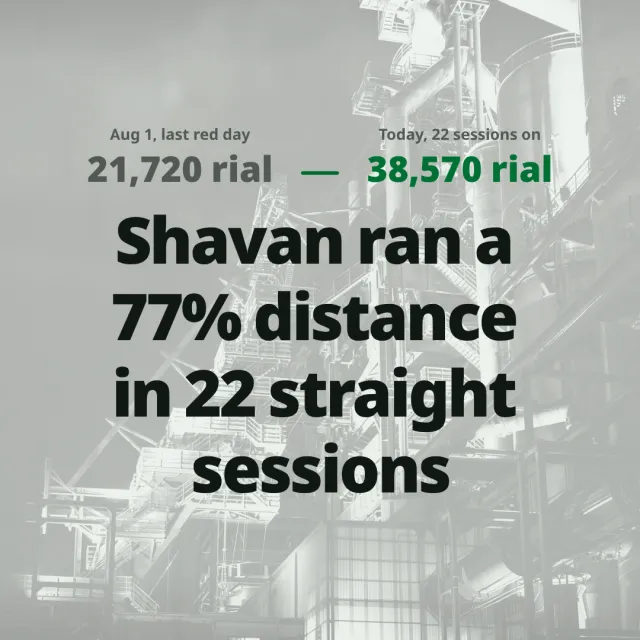 01:21Short
Shavan Shares Rose 77.6% Over 22 Straight Sessions While Quarterly Profit Fell 90% (Saturday, September 5, 2026)
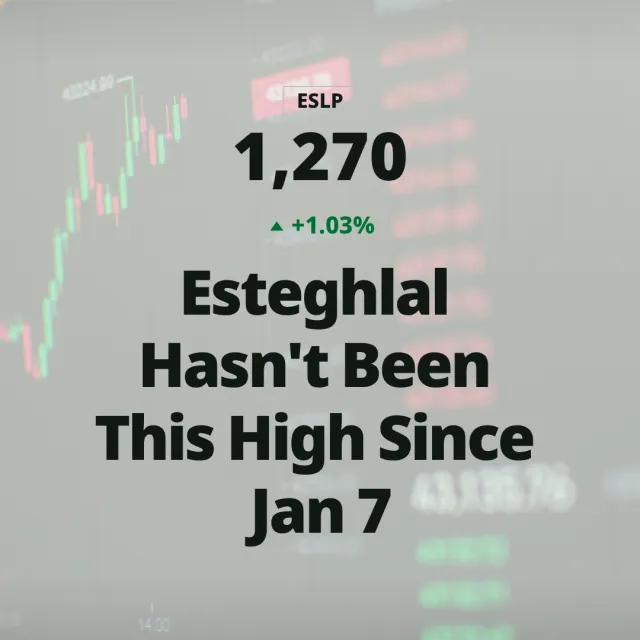 01:15Short
Sports Ministry Fully Exits Esteghlal Football Club's Shareholder Register; Its 3.1% Stake Lands at a Persian Gulf Financial Group as the Stock Hits an Eight-Month High (Wednesday, September 2, 2026)
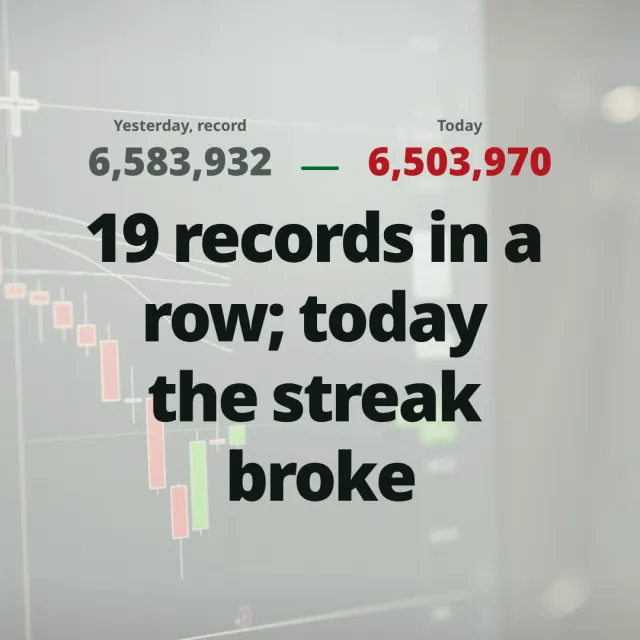 01:12Short
Tehran's TEDPIX Falls 1.21% Today, Wednesday, Ending a Rally of At Least 19 Straight Gaining Sessions (September 2, 2026)
 01:02Short