
What Is Technical Analysis? Trend, Support and Resistance, and Moving Averages, Explained Simply
This lesson explains what technical analysis is and how it differs from fundamental analysis, how to read its three basic tools (trend, support and resistance, and moving averages), why they describe the past rather than predict the future, and what you need to know in Iran's market, from the daily price limit to the legal warning against selling trading signals.
Transcript
A lot of people believe that a chart can tell them the future price, but in reality it cannot, and today we see why. In this lesson, we learn the three basic tools of technical analysis, simply. Why does it matter? Because these tools organise observation, they do not predict. Technical analysis means studying the past behaviour of price and volume on a chart. The three main tools: trend, support and resistance, and moving averages. Trend is the dominant direction of price: up, down, or sideways. Support is a repeating floor, resistance a repeating ceiling; zones, not exact lines. A moving average smooths the noise and shows the medium-term direction. Suppose a share has moved between one thousand and one thousand two hundred tomans. Technical analysis does not promise a bounce; it only describes the past. In Tehran, the daily price limit creates buy and sell queues. Read an adjusted chart, or capital raises and dividends will mislead the trend. An important warning: selling signals without a licence is a crime under Article forty-nine. Three mistakes: treating it as prophecy, overfitting the past, and trusting signal sellers. Bottom line: technical analysis is a tool of description, not a prediction machine. Now you have the answer: a chart describes the past, not the future. Save this lesson and review it later.
Related videos
 01:08Short
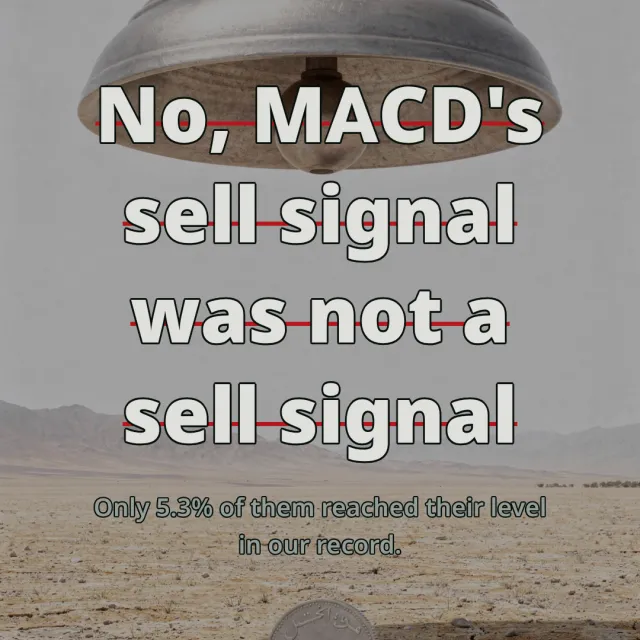
In Sahmino's Signal Scorecard, Settled Bearish Claims Reached Their Level 15.4% of the Time in a Rising, Low-Volatility Market Against 87.7% for Bullish Ones; the Bearish MACD Cross Was Lowest at 10 Hits Out of 189 (Wednesday, 16 September 2026)
 01:08Short
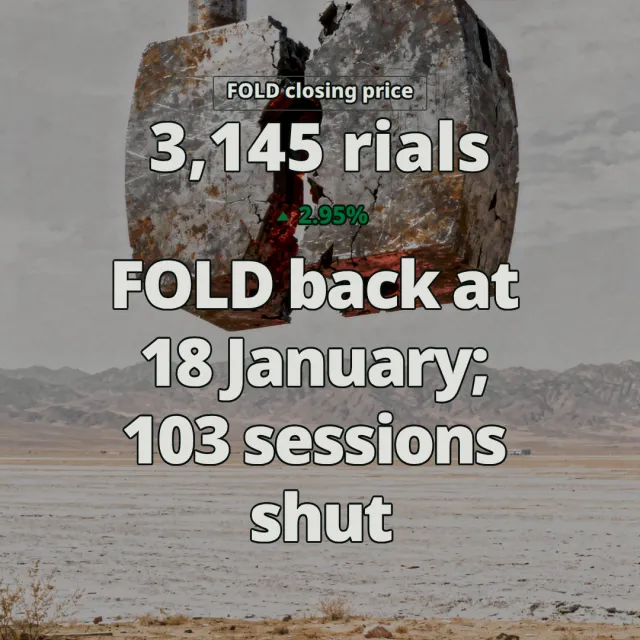
Mobarakeh Steel closed at its highest since 18 January 2026 after 103 sessions without a trade, on the day Tehran's index closed red (Monday, 14 September 2026)
 01:16Short
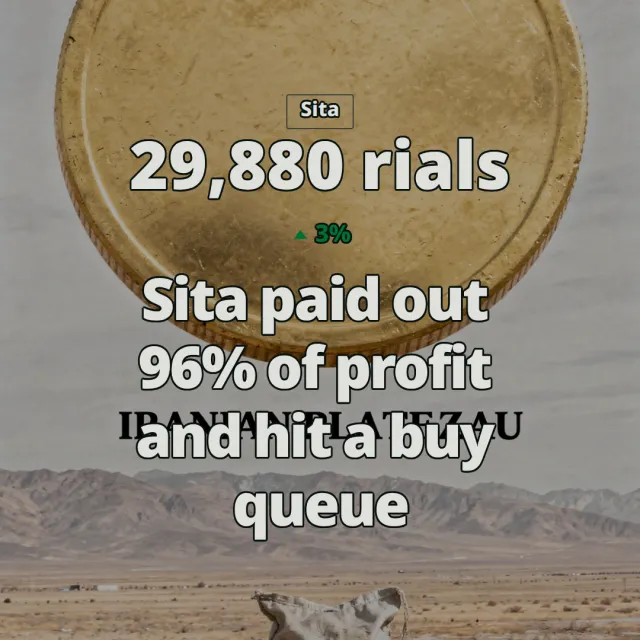
Sita's AGM voted out 96.58 percent of the profit for the year to 21 May 2026; the share has closed at its 3 percent daily cap in all four sessions since it reopened and ended 13 September in a 28 million share buy queue
 01:21Short